Data Science Explored a space to learn and analyze
Examining the Effectiveness of MLB's 2020 Sixty Game Baseball Season using Python
** UNDER CONSTRUCTION **
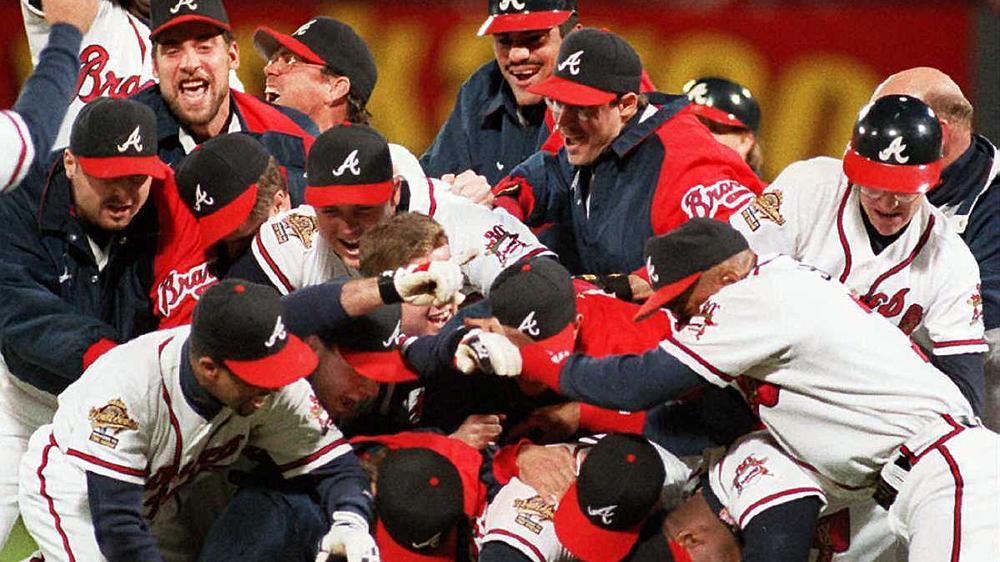
On June 23, 2020, Major League Baseball (MLB) announed they were officially coming back and instituting a sixty game baseball season for the 2020 campaign. Baseball fans everywhere rejoiced; excited to be able to watch the sport they love again, and get a temporary reprieve from the mundane lifestyle set in by the coronavirus pandemic. Since this announcement, I have found myself contemplating how worthwile this shortened season will be. There is no doubt an asterick will be placed beside this season and it’s outcome, but how large will this proverbial asterick be? To answer this question, I focused my analysis on determining whether or not this sixty game season, plus the expanded postseason format instituted by Major League Baseball, would produce the rightful playoff teams, and give the best teams from each division a shot at the Commissioner’s Trophy. Follow along to determine if you should celebrate (socially distanced of course) when your team hoists the crown, or if this season should be viewed merely for it’s entertainment purposes.
(Define the question better)
Before diving into how I obtained the data and the subsequent analysis and visualizations produced, lets get an understanding of the differences between a traditonal baseball season and this 2020 COVID-impacted one.
| Traditional Season | 2020 Season | |
|---|---|---|
| Number of Regular Season Games Played | 162 | 60 |
| Number of Playoff Teams from Each League | 5* (3 Division Winners + 2 Wild Card Winners) | 8 (1st and 2nd Place Teams from Each Division + 2 Wild Card Winners) |
| Number of Total Playoff Teams | 10 | 16 |
* From 1969 through 1993, there were two divisions in each league and only the two division leaders made the playoffs at season’s end (for a total of four playoff teams). A new system was instituted for the 1994 season (but first used in 1995 due to a players strike canceling the 1994 playoffs) expanding from two to three divisions per league and adding a wild card team that made the playoffs as the fourth seed. The wild card team was the team with the most wins amongst non-division winners. In 2012, the system was modified yet again to add a second wild card team per league to the playoff mix.
Now that that is out of the way, lets get to the fun stuff. I acquired data for the last twenty-five baseball seasons (1995 - 2019) by web scraping multiple sites using Selenium (to learn how to do this yourself, be sure to check out this tutorial). The data collected involved:
- Sixty game records and standings for every team
- Season ending records and standings for playoff teams
- World Series winners and losers
- Division team information
- Full team names
The various pieces of data were stored in dictionaries and lists. After performing some cleaning and manipulation, the pieces of data were combined into a MultiIndex DataFrame.
(Screenshot of sorted DataFrame)
Useful elements were extracted from the DataFrame to determine whether or not this sixty game season and subsequent expanded playoff format would produce the appropriate playoff teams compared to past seasons. After multiple iterations through the DataFrame to analyze and understand the data, a couple of visualizations emerged which indisputably answered the question.

- Swarm plots


Please leave a comment at the bottom of the page to let me know your thoughts on the project and the actions I took to arrive at the final model. At the end of the Project Overview, there are questions posed for reflection and deliberation - feel free to answer one of those too if you would like.
Project Summary
Code snippets will be provided for each section outlined in the Project Overview at the bottom of the page. The snippets will encompass the entire script, broken into their related sections. If you would like to view the code script in its entirety, please visit this link.
Project Overview
i. Data Ingestion
ii. Data Cleaning
iii. Exploratory Data Analysis
iv. Model Building
v. Model Visualization, Comparison, and Selection
vi. Visualize Best Model
vii. Model Usefulness
viii.Questions for Consideration
Data Ingestion (View code)
Data Cleaning (View code)
Exploratory Data Analysis (View code)
Model Visualization, Comparison, and Selection (View code)
Questions for Consideration/Analysis Expansion in the Future
- Pull all teams season ending records and statistics (correlations between 60 game playoff teams and their final result and 60 game standings and playoff teams - their correlations) .54 Season ending standings for playoff teams - could look more in-depth at correlations 162 games needed (i.e. longer season) to determine rightful playoff teams
- Team with teams
- More ambiguity and more randomness/complexity to baseball that needs 162 games to sort itself out.